A crowded retail shelf is a difficult detection problem: dozens of similar packages touch one another, some products are partly hidden, and many objects become tiny when the full photograph is resized. Our YOLO-NAS retail training video uses SKU110K to explore that problem, with a public project that carries the workflow from annotation inspection to ONNX inference.
The useful distinction is that this model detects product instances. It does not identify the exact SKU of every box or bottle. Counting visible product fronts and recognizing their catalog identities are separate stages, and the repository is focused on the first one.
Four notebooks, from data to deployment
The project repository contains notebooks for dataset preparation, model training, inference, and deployment. It also includes a yolo_nas_onnx package with model loading, preprocessing, postprocessing, drawing, and command-line utilities. This makes it possible to inspect both the training recipe and the assumptions made when running the exported graph.
The training notebook pins an older environment, including SuperGradients 3.1.3. Reproducing that experiment and building a new production environment are different tasks. Use an isolated environment for the original notebook and verify compatibility deliberately rather than assuming its package pins belong in an unrelated modern application.
Check the labels before starting a run
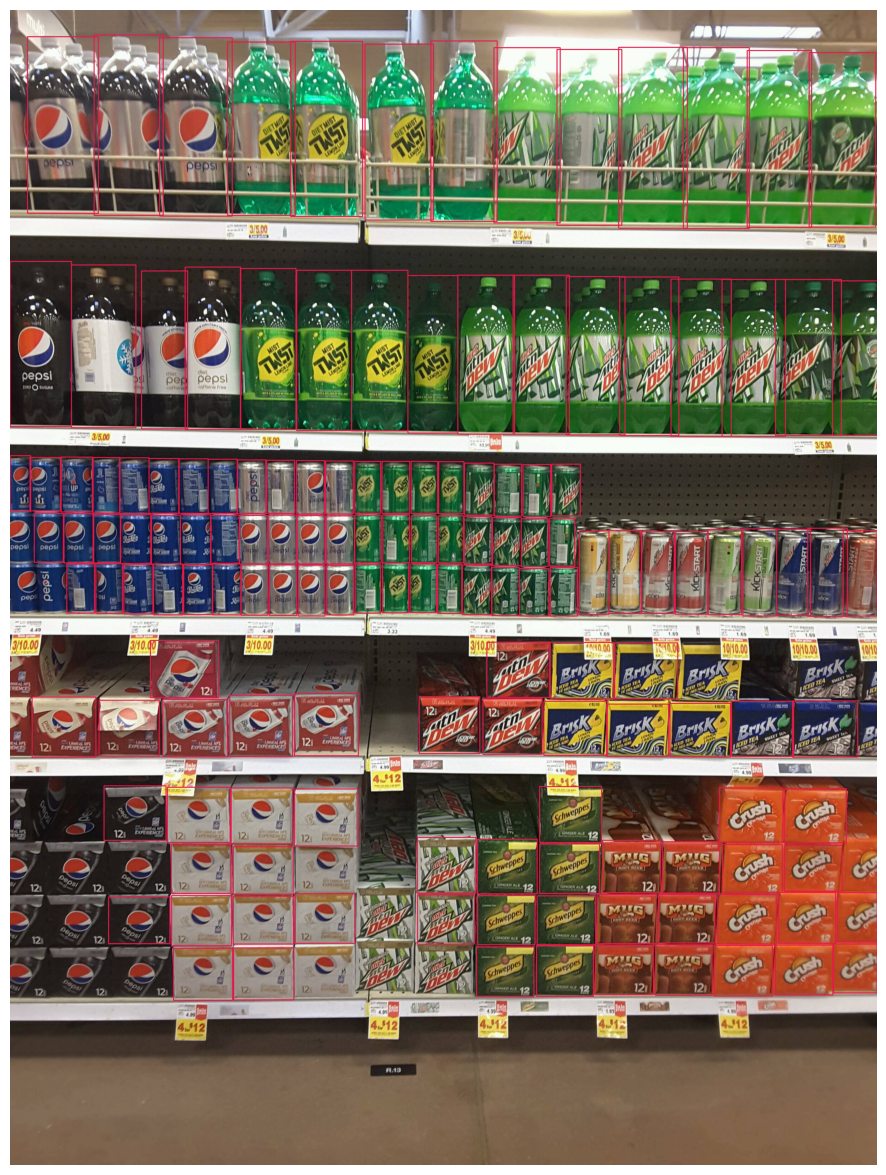
The preparation notebook draws SKU110K annotations over shelf images. Its input label files use the familiar normalized center-and-size representation: class ID, center x, center y, width, and height. A visual check is essential because a coordinate convention error can produce a training run that completes successfully while learning from incorrect boxes.
For normalized values, the conversion to corner coordinates is straightforward:
# Illustrative conversion for one YOLO-format annotation.
x1 = (center_x - box_width / 2) * image_width
y1 = (center_y - box_height / 2) * image_height
x2 = (center_x + box_width / 2) * image_width
y2 = (center_y + box_height / 2) * image_height
Inspect examples with clipped products at the image boundary, repeated packaging, and heavy occlusion. These establish what the dataset considers a countable instance. They also expose the gap between a dataset's labeling policy and the business question: visible product fronts do not reveal hidden stock behind them.
Understand the checked-in model choices
The notebook initializes yolo_nas_s from COCO pretrained weights, uses an Adam optimizer with a cosine learning-rate schedule, and configures a maximum of 300 epochs. The export example uses a 640 × 640 model input. Those are specific choices from the demonstration, not a measured guarantee of accuracy or speed on your shelves.
One implementation detail deserves attention before adapting the code: the class list begins with product and is then padded to 80 entries. That reflects the example's setup; it is not evidence of an 80-category retail recognition model. Keep dataset IDs, training head size, and inference label mapping consistent when changing the class configuration.
The training metric is mAP at an IoU threshold of 0.50. Read that definition when comparing results. It should not be casually compared with a metric averaged over multiple IoU thresholds, and it does not capture every counting error that matters operationally.
Resolution and suppression change the result
Resizing a wide shelf image to 640 pixels can leave individual products only a few pixels across. If the task requires small-object recall, inspect the resized inputs rather than judging only the original photographs. A larger input or tiled processing may preserve more detail, but adds compute and a need to reconcile predictions across tiles.
Non-maximum suppression is especially sensitive in a dense scene. Nearby legitimate products can overlap in the image, so a suppression setting that works for isolated objects may remove useful detections. Conversely, weak suppression can leave duplicate boxes on a single product and inflate counts.
The deployment example applies OpenCV's NMSBoxes after postprocessing. That is important when inspecting the ONNX graph: do not assume this project's exported model already performs all suppression internally. The graph and the surrounding inference code form the deployed detector together.
Preserve preprocessing when you export
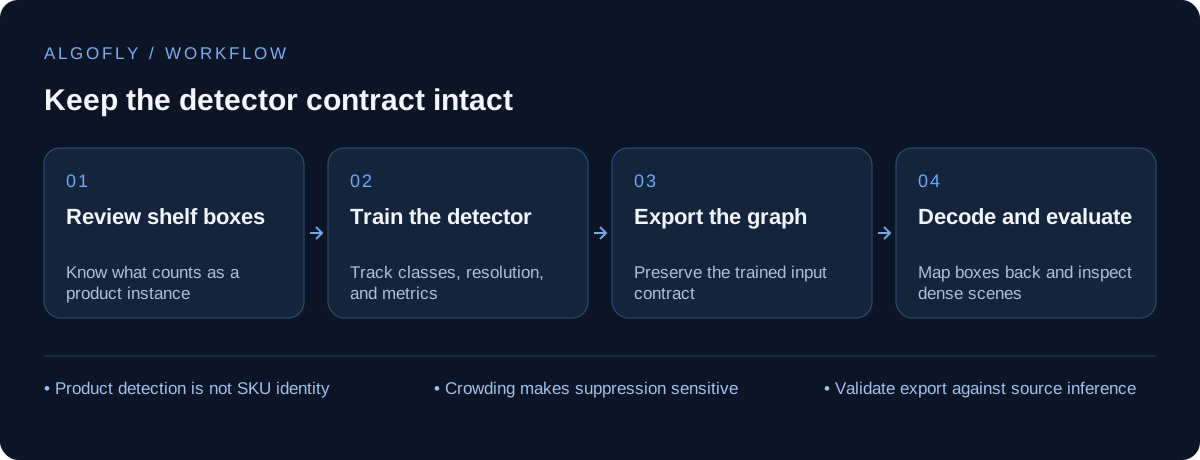
The deployment notebook exports a trained checkpoint and loads it through a small runtime abstraction. It exposes both ONNX Runtime and OpenCV DNN options. Its preprocessing includes a longest-side resize and bottom-right padding, followed by postprocessing that maps predictions back into the source image.
Those steps are part of the model's contract. Replacing them with a direct stretch can change both appearance and box geometry. Preserve the original width, height, resize scale, and padding offsets so that a returned box can be drawn correctly on a photograph of any aspect ratio.
Validate the exported pipeline against the training-framework pipeline on the same small set of images. Compare detection coordinates, scores, class IDs, and final suppression behavior. An ONNX file being loadable only proves that the runtime accepts it; it does not establish that preprocessing and output decoding are correct.
Measure what the application will use
For a counting workflow, compare predicted and reviewed counts per shelf image, then inspect errors by product size and crowding. For a crop-and-recognize pipeline, measure whether the detector captures enough of each package for the next model. A slightly tighter box may look better but cut away the text or logo required for identification.
Split evaluation data by the real source of variation where possible: store, shelf, capture session, or camera. Near-identical photographs in training and testing can make generalization look stronger than it is. Keep a small set of images from the intended deployment environment for an explicit domain check.
Before choosing YOLO-NAS for a new deployment, also inspect the applicable model-weight terms in the upstream project. The software repository and the pretrained model weights have separate licensing information. This article explains the original experiment rather than making an unrestricted-use claim about every artifact.
Build recognition on a clear boundary
A detector can supply product crops to an embedding or classification stage. That second stage can match a crop against a catalog, while separate logic links detections to price labels or shelf positions. Keeping those responsibilities separate makes failures easier to diagnose: missed object, poor crop, wrong catalog match, and incorrect price association are different problems.
Our image embedding guide covers the representation-learning side of that design. Combined carefully, detection and retrieval can become a useful retail workflow without pretending a single box model solves the entire shelf-analysis problem.