A map becomes more useful when it can explain what changed in a field, which observations support that conclusion, and how the same question looks across a wider region. Galicia is an agricultural intelligence application we developed to connect those levels: regional navigation, crop parcels, satellite vegetation indices, annual observations, and yield comparisons in one working interface.
The project is a private client application. This article describes the capabilities and engineering decisions we can show publicly; the Galicia case study presents the product workflow without exposing its operational deployment.
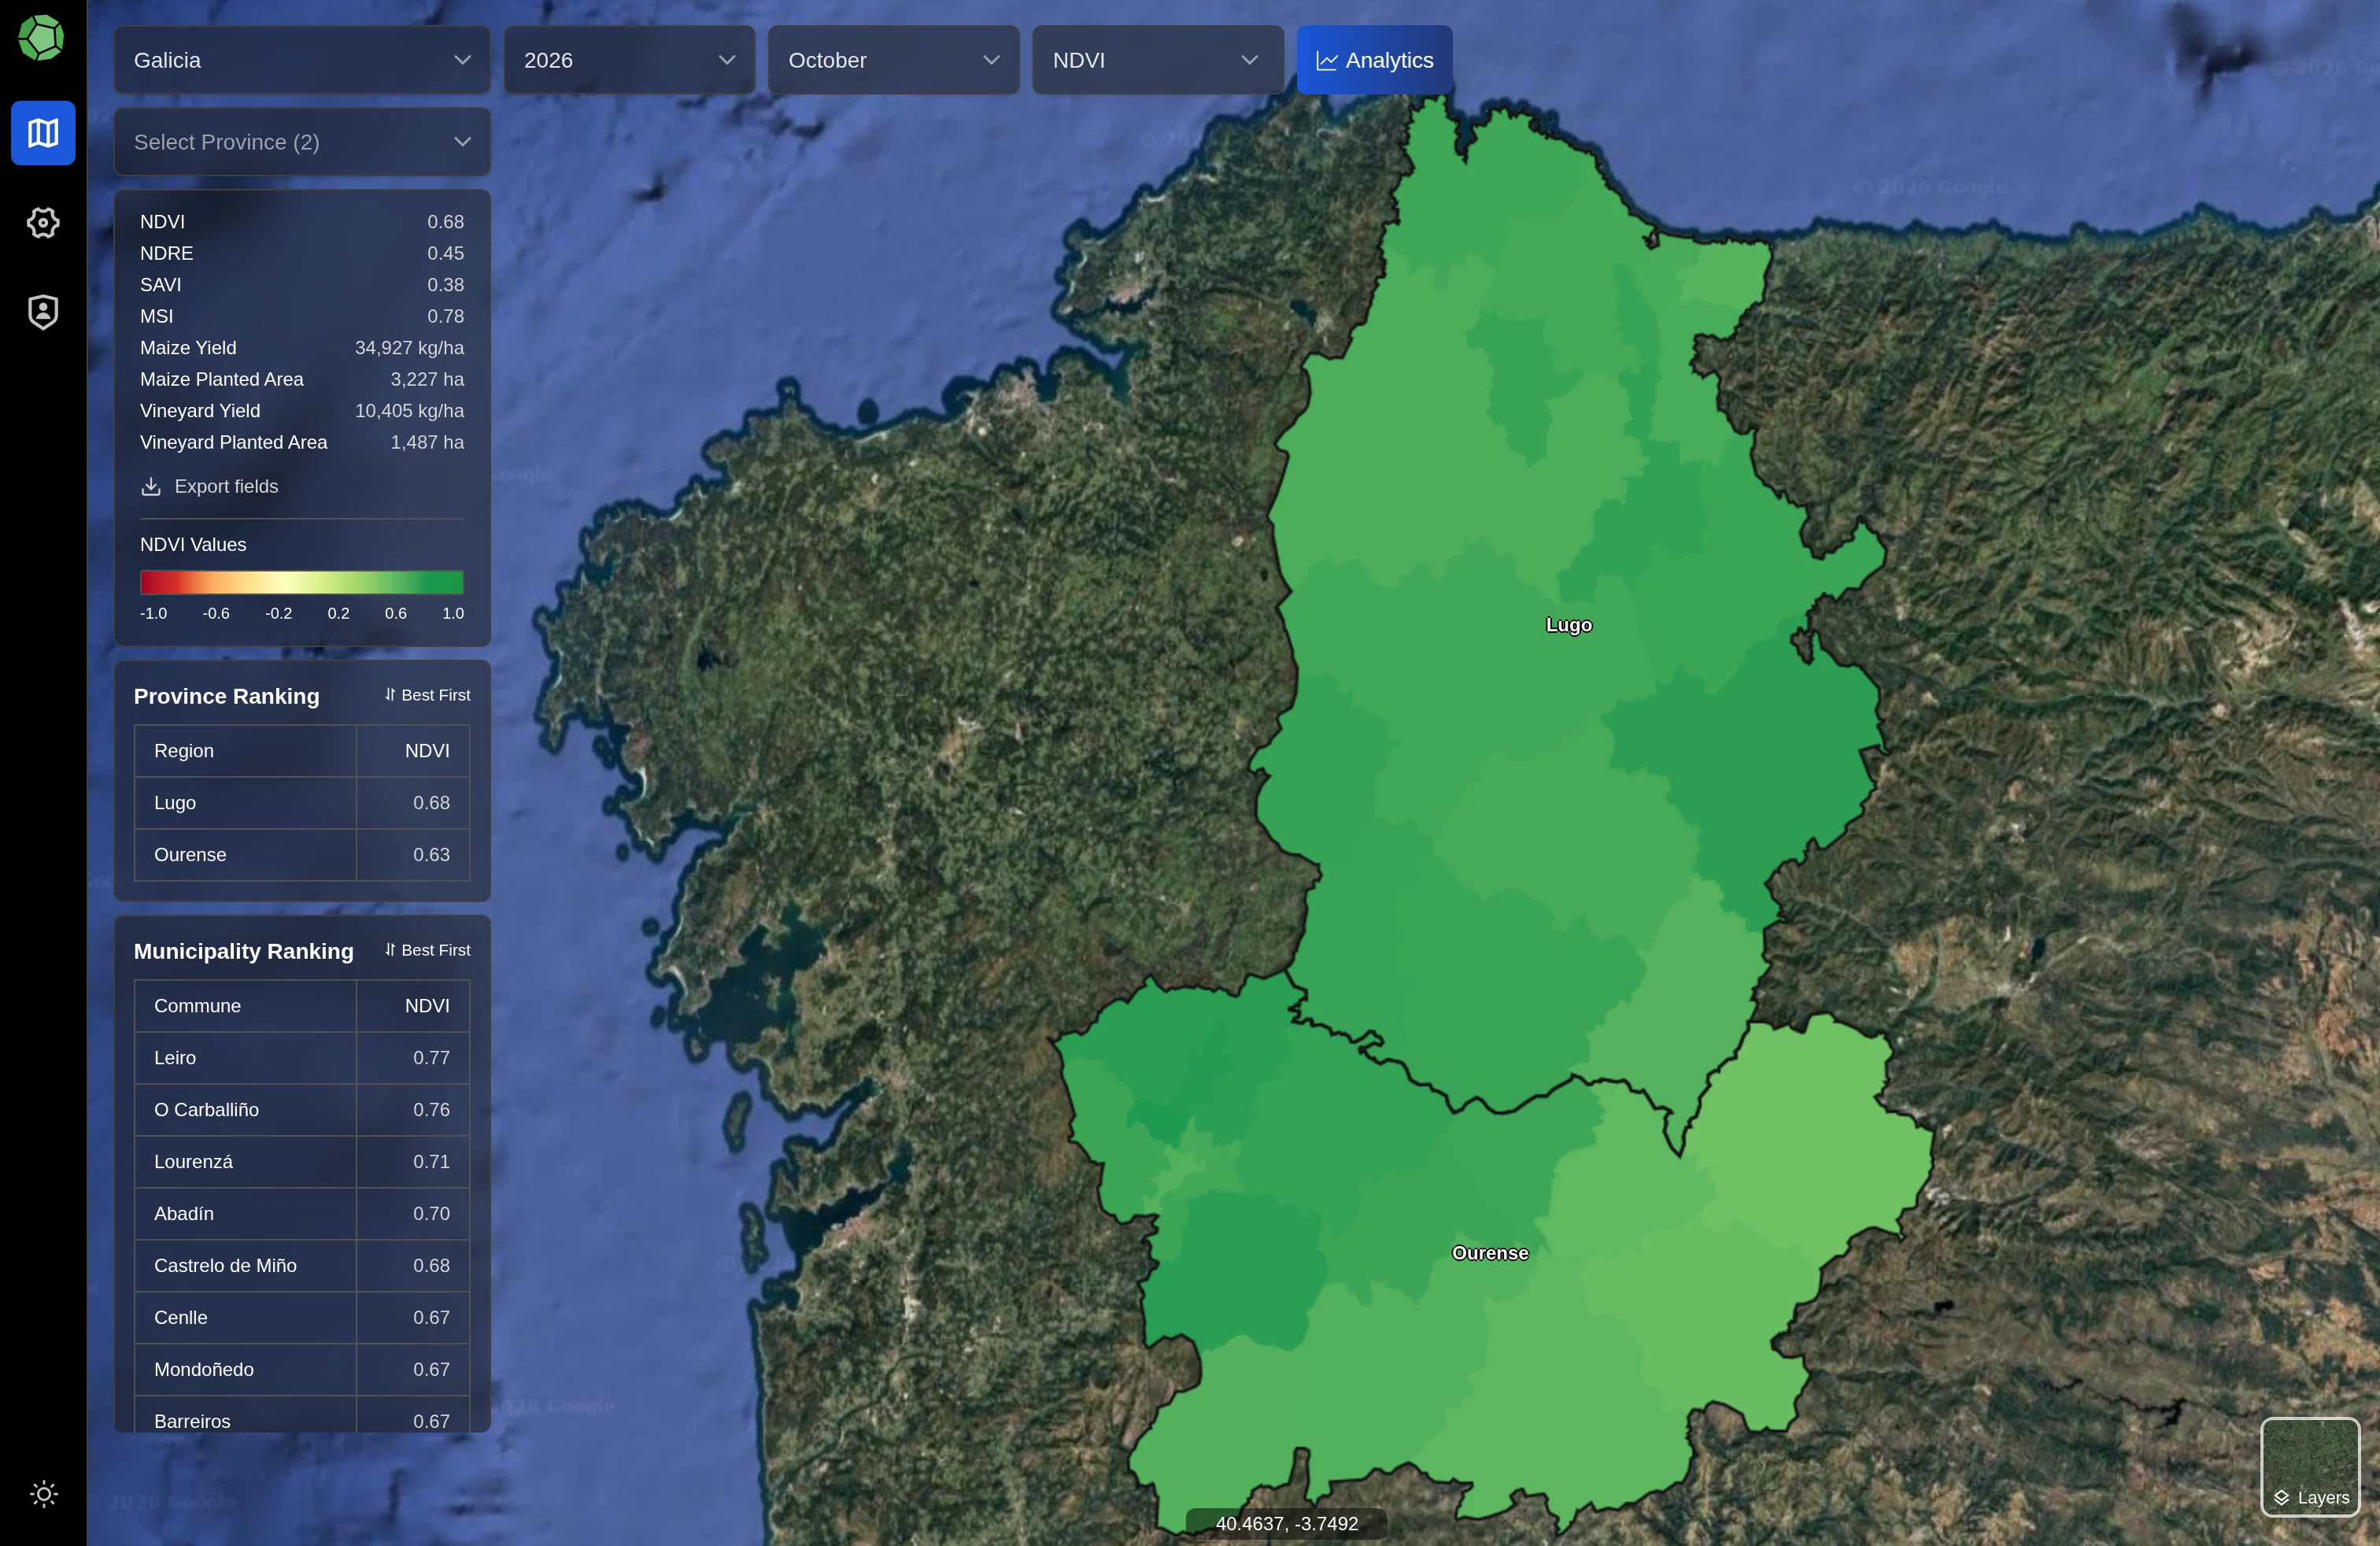
One map, several scales of agricultural information
The application starts with the geographic hierarchy and lets users move from Galicia into provinces and municipalities. Crop filters, season selection, the selected month, and the current analytical feature travel with that navigation. A regional overview and an individual field do not need to look identical, but they should answer compatible questions.
At higher levels, the map emphasizes summaries and ranking tables. At the field level, users can inspect parcel geometry, annual crop information, and index history. That separation keeps the overview legible while preserving access to the underlying observations. Field-count views also work independently of whether a new satellite processing run has finished.
A saved view retains the selected area, map position, zoom, season, month, crop filters, and feature. Reopening a link restores the analytical context rather than sending someone back to a generic map. That is a small interaction detail with an important consequence: two people can discuss the same view without manually reconstructing a chain of selections.
Treat geometry and annual observations differently
A parcel's shape and its observation in a particular year are related, but they are not the same record. Galicia keeps a stable geometry layer alongside annual crop observations and administrative membership. This supports historical views without duplicating identical shapes for every season or losing the relationship between a field and its past measurements.
Boundary handling matters too. A parcel crossing a local administrative border needs to remain available where relevant, while a province-level count should not double-count the same geometry. Spatial membership and aggregate counting therefore have to be designed together. Simply concatenating local lists would produce a plausible-looking total with the wrong meaning.
The application makes the distinction visible through crop filtering, field outlines, and inventory-aware summaries. It lets an analyst compare the selected season's parcels with the observations available for that season instead of silently mixing the newest inventory with an older satellite month.
Make the index layers comparable and explainable
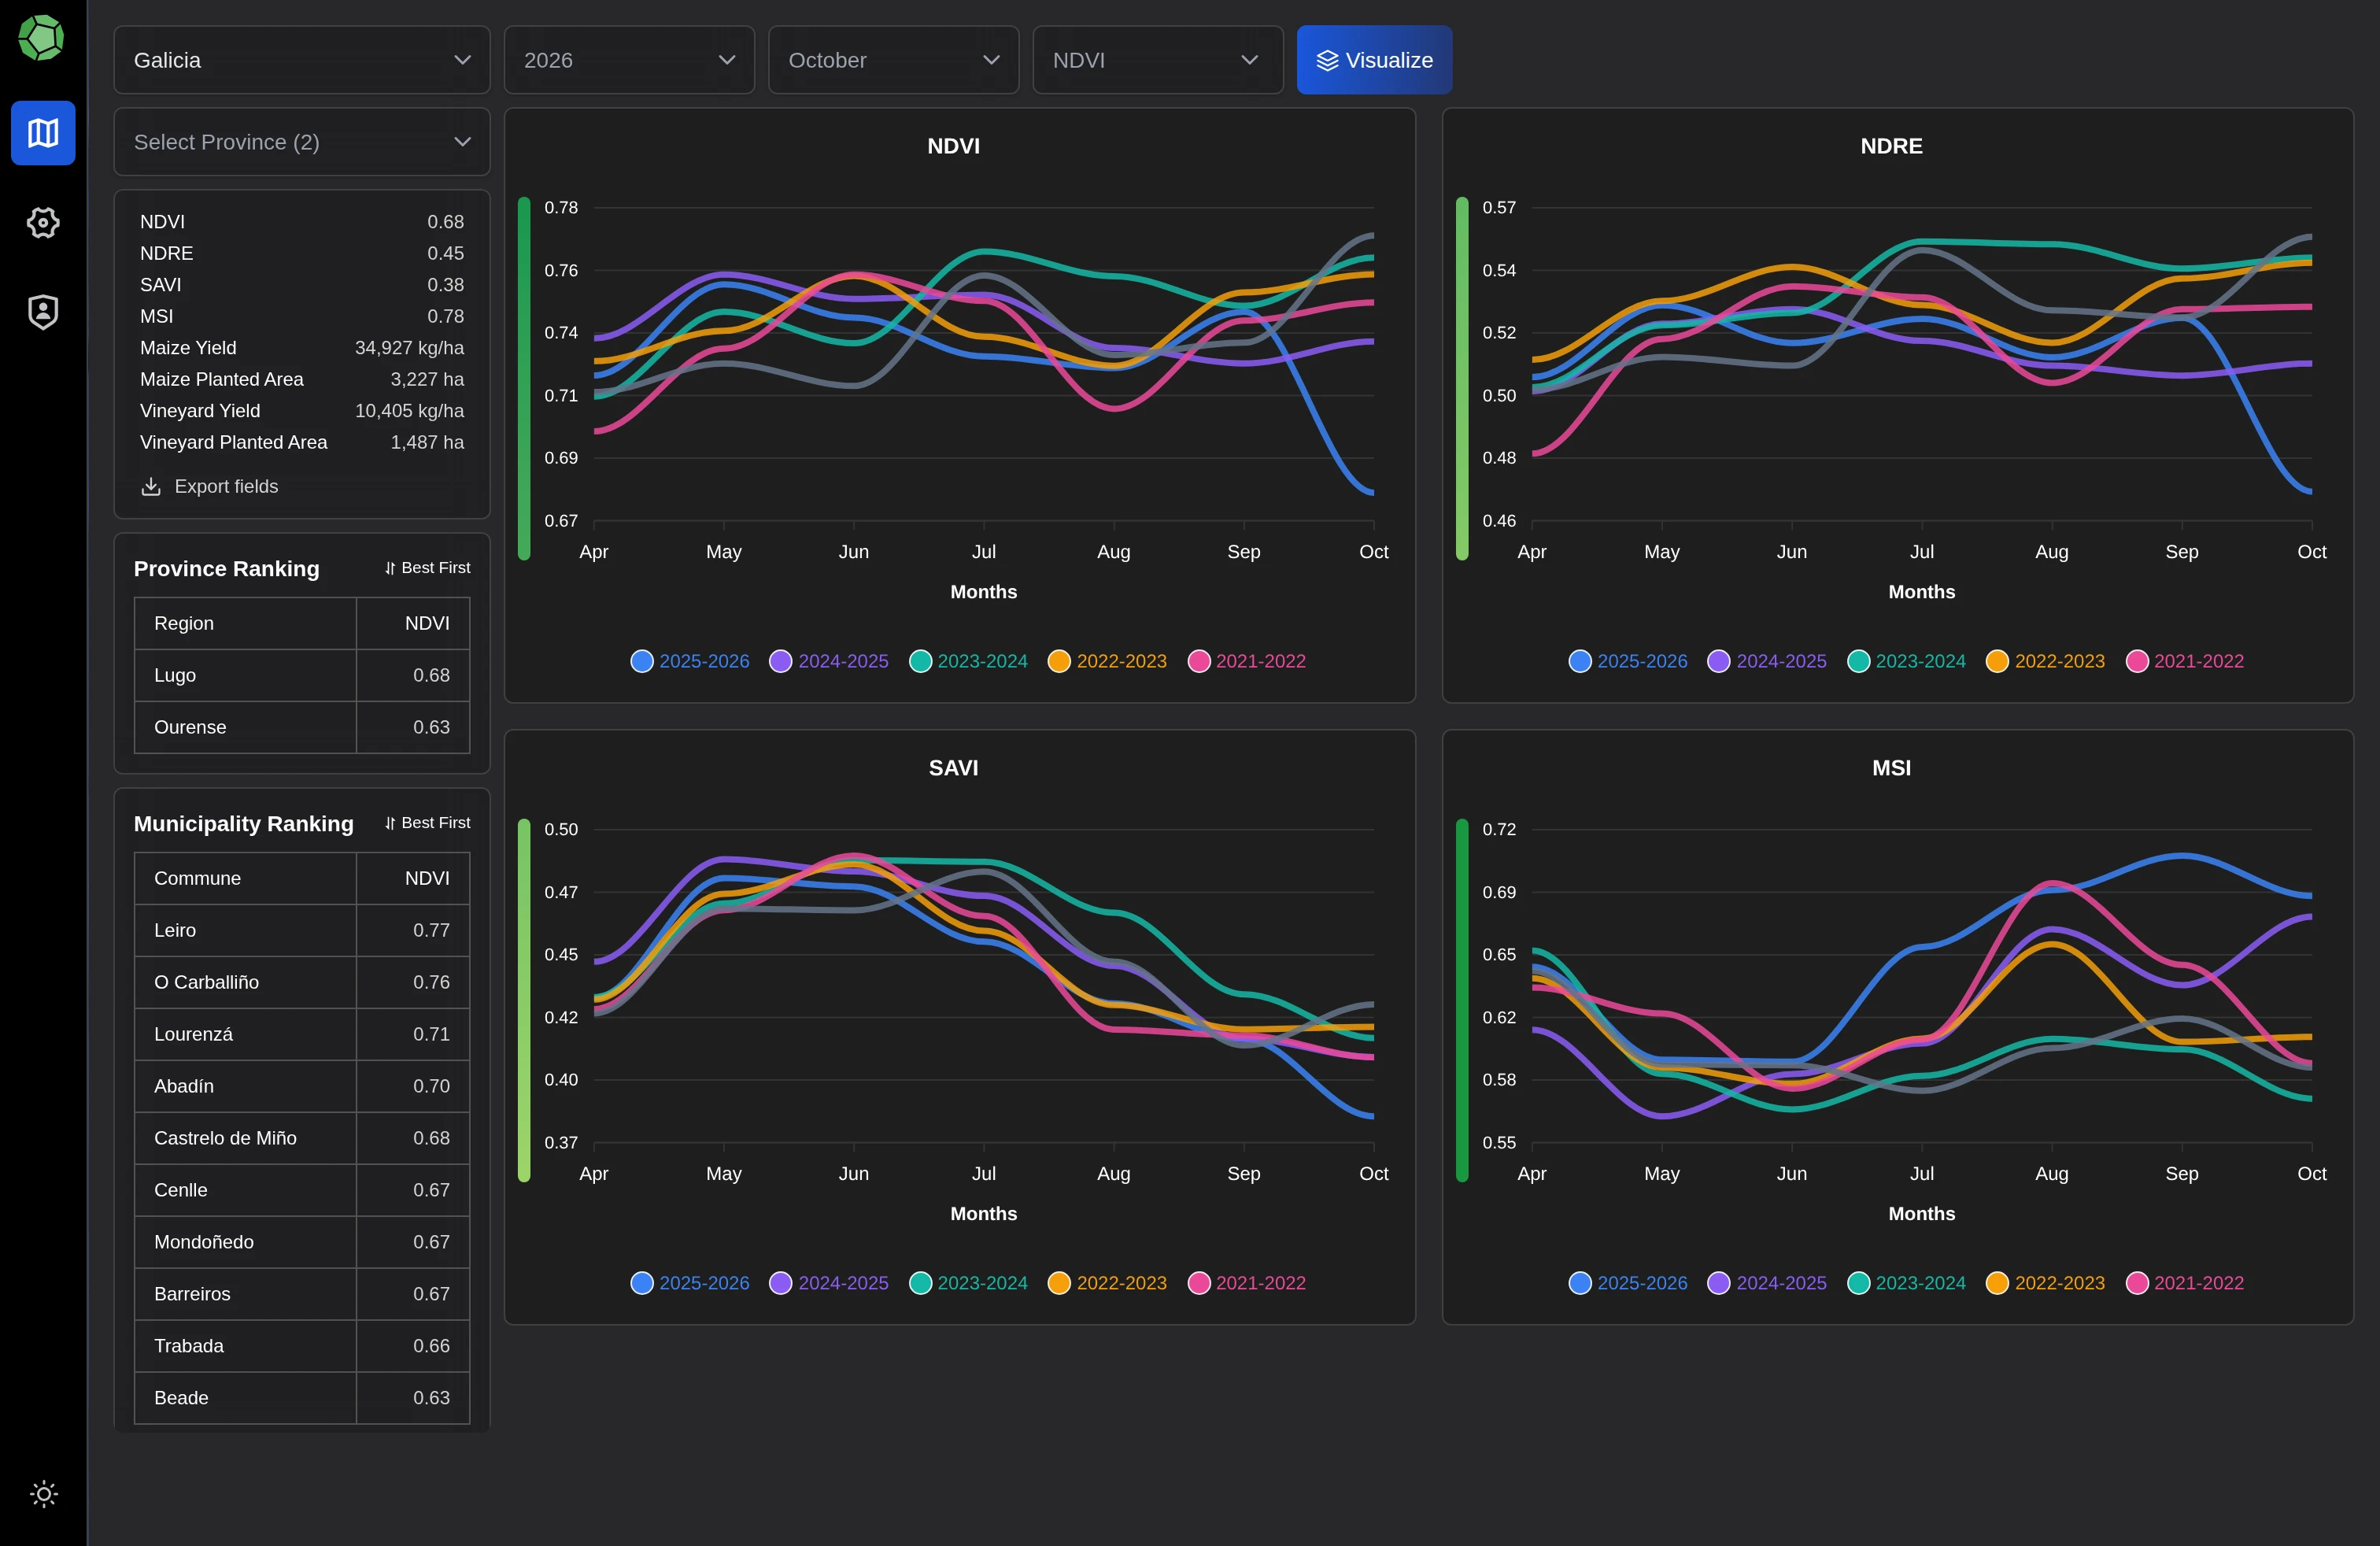
Galicia supports NDVI, NDRE, SAVI, and MSI. Each has a different interpretation, so its legend and chart scales remain consistent across the interface. Selecting another index changes the analytical layer, not the underlying geographic identity of the field being inspected.
The processing workflow applies source calibration and quality screening before computing the indices. Cloud, cloud-shadow, snow, and invalid observations are excluded. This avoids treating every downloaded pixel as equally useful simply because it exists in a source image.
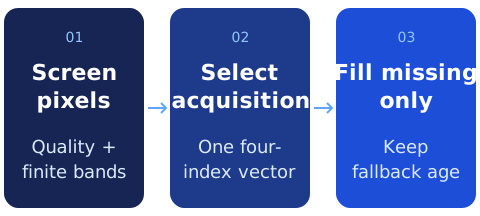
The monthly composite uses the acquisition with the highest clear NDVI for a pixel and takes all four indices from that same acquisition. It is a quality-selection composite, rather than a monthly arithmetic average. Keeping that interpretation explicit helps prevent a map value from being compared with another dataset that summarizes time differently.
Keep missing information distinct from a low value
Cloudy periods create gaps. The worker can fill a missing monthly pixel from a recent clear acquisition within a bounded historical window, while retaining the age of that fallback in the processing provenance. Pixels that remain unsupported stay unavailable. A missing observation should not become an invented zero that looks like a severe change in vegetation.
The same principle carries into field statistics. The application records valid coverage and can withhold an observation when coverage is insufficient. An absent number communicates something different from a genuine low index value, and the data model preserves that distinction.
For small or irregular parcels, a satellite pixel may overlap only part of the geometry. The worker weights intersecting pixels by overlap area when calculating field means. That is particularly useful for narrow vineyard parcels, where accepting or rejecting a whole pixel based only on its center can discard useful evidence or overstate coverage.
Compare annual estimates without inventing a new measurement
The yield view uses imported annual source estimates. It does not present a vegetation index as a newly measured harvest, and it does not claim the application independently validated a yield model. Where the source units are not confirmed, the interface retains the per-hectare interpretation without guessing whether the number means kilograms or tonnes.
At municipality level, users can choose one year for an absolute view or two years for a comparison. The difference has a clear direction: newer-year value minus older-year value. A signed color scale separates decreases from increases, while field details and summaries retain the selected years.
The comparison follows the crop and inventory semantics defined by the imported data. Its summaries use parcel area, and the interface can return to the ordinary index view without leaving a stale comparison filter behind. A useful comparison tool needs that state discipline as much as it needs a red-and-green map.
Keep heavy analysis away from the browsing session
Satellite computation runs in a separate worker. The interactive application reads published observations and analytical tiles, rather than asking a browser to download full source rasters and compute them while someone waits. Processing jobs retain their source metadata, algorithm version, coverage, and output revision.
Publication is transactional. Users continue reading a complete dataset revision while a replacement is prepared; caches advance when the new revision is available. The worker supports bounded processing windows and reuse of intermediate work, which matters when source downloads are slow or a run must resume.
The RGB basemap has a separate role from analytical rasters. Display preparation can improve the visible imagery without rewriting the original measurements. Server-side tiling and cached responses keep the browser focused on the current view, and the surrounding map remains usable when one optional imagery layer is unavailable.
Preserve context while data changes
Map navigation can be technically correct and still feel fragile if every selection clears the screen or resets the camera. Galicia preloads lightweight boundary geometry, caches visited areas, and restores saved URL state. The interface can show the correct hierarchy early and refine detail without changing the question the user was asking.
Field details, crop-colored outlines, hover states, weather context, and light and dark themes all belong to the same interaction system. Those details help users keep their bearings as they move between a regional pattern and one parcel's history.
Select the observation before calculating the summary
The index calculation starts with a shared validity mask. Scene-classification values identify usable pixels; the required spectral bands must also be finite and non-negative. Each ratio has a denominator check, so a division near zero produces an unavailable result rather than an extreme number that later colors the map. All four computed indices have to be finite before an acquisition can replace a composite pixel.
For every candidate acquisition, the worker compares its NDVI against the current best value at each pixel. When the candidate wins, it copies the complete four-index vector. NDRE, SAVI and MSI therefore describe the same chosen acquisition as NDVI. Choosing each index's maximum independently would construct a synthetic combination that might never have existed in a single observation.
Historical filling then works on a copy of that monthly result. It identifies pixels inside the processing area that still lack a complete index vector, reads eligible clear historical samples and replaces only those missing positions. Already supported monthly pixels remain unchanged. A separate age raster records how many days separate the fallback acquisition from the target month; positions that remain invalid retain an unavailable age as well.
Let a partial pixel contribute a partial area
For parcel geometries, the zonal accumulator calculates the intersection between each relevant satellite cell and the field. A fully contained cell contributes its whole area. A boundary cell contributes its intersecting area. This is different from counting every touched cell equally, and particularly useful when a narrow parcel occupies only a small fraction of a cell.
The accumulator keeps the weighted index sum, valid area and total sampled area separately, alongside pixel counts. The following notation summarizes the calculation; it is an explanation of the algorithm, not a production API response:
field_mean = sum(index_value × valid_overlap_area)
             / sum(valid_overlap_area)

coverage = valid_overlap_area / total_sampled_overlap_area

publish mean only when valid area exists
and coverage meets the configured minimum
A withheld mean still retains its coverage record. That lets the application distinguish an insufficient observation from a low measurement without discarding the reason for withholding it. The implementation has a separate rasterized-area path for aggregate geometries, so exact cell-intersection treatment should be attributed to the parcel calculation rather than claimed for every administrative summary.
Availability, completeness and change are separate signals
The raster readiness query checks whether stored chunks intersect the selected administrative boundary. A separate check looks for a completed regional observation associated with a job, while active job states report ongoing processing. These signals answer different questions: some raster data may be available even while the broader analytical publication is incomplete.
Revision metadata also combines the relevant month’s index revision with a yield revision. An update to either dataset can therefore change the revision exposed to readers. This is more precise than invalidating every map resource on every navigation, and more honest than using a single “loaded” flag to imply that every layer is complete. The engineering contract is explicit readiness and revision information; it should not be stretched into a claim of one universal transaction covering every cache, raster and external source.
An agricultural product needs more than a prediction layer
The distinctive work in Galicia is the connection between spatial data, time, provenance, and interaction. Stable parcels make historical records coherent. Quality and coverage rules keep unavailable information honest. Published revisions let intensive satellite processing coexist with an interactive map. The result is a capability we can demonstrate through the application workflow, without inventing business-impact percentages or exposing a client's environment.
Explore the Galicia capability case study for the visual overview, or talk with AlgoFly about building a geospatial application around your own data and review process.